Visualising Many Variables
Data Visualisation and Analytics
Anastasios Panagiotelis and Lauren Kennedy
Lecture 6
1
Beyond two dimensions
2
Visualising many variables
- We can do more than visualise variables spatially
- Colour
- Size
- Label
- Facets
3
An example
4
Mpg data
- The variable
ctymeasures fuel efficiency of different cars in the city, whiledisplmeasures the size of the engine. - These are negatively correlated.
- We can also see how the non-metric variable
drvinteracts with these variables using thecol(colour) aesthetic.
5
Using color
ggplot(data = mpg,mapping = aes(x=displ,y=cty, col=drv))+geom_point()
6
Aes v geom
- Note that unlike the last lecture, color is being used here to display information about a variable in the dataset.
- Therefore instead of specifying color in the geom, it has to be specified in the
aesfunction. - Remember the
aesfunction maps data to something we can perceive.
7
Text labels
- Another option is to plot text rather than points
- This is in fact a different geom called
geom_text - This was used on some of the plots demonstrating Zipf's Law
- This is in fact a different geom called
- A variable can be mapped to the actual text that appears
- The aesthetic is
label
- The aesthetic is
8
With text
ggplot(data = mpg,mapping = aes(x=displ,y=cty, label=drv))+geom_text()
9
The bubble chart
- To add a fourth variable we can manipulate the size of the points.
- This is known as a bubble chart.
- The aesthetic in question is
size - The following plot maps the number of cylinders to the size of points.
10
Bubble plot
ggplot(data = mpg,mapping = aes(x=displ,y=cty, col=drv,size=cyl))+ geom_point()
11
All about colourmaps
12
Color scales
- Suppose we are mapping metric or ordinal data to a colormap. The colormap should be
- Sequential
- Perceptually uniform
- Work when printed in black and white
- Accessible to colorblind people
- Colorful and pretty
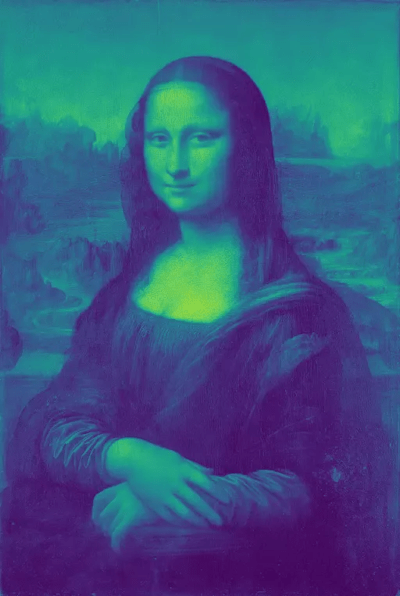
- The viridis colormap was developed with this in mind
13
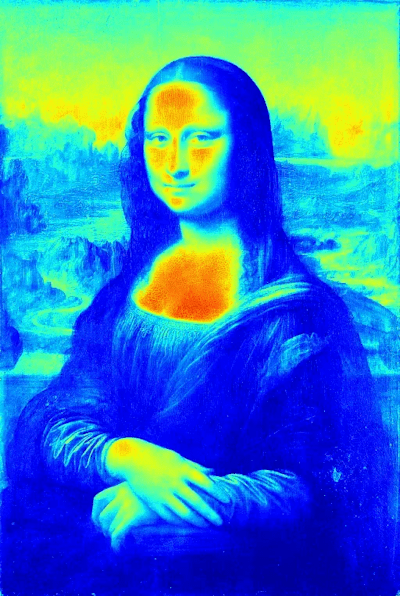
Jet v Viridis
A popular palette is jet.

A better palette (by the above criteria) is viridis

14
Problems with jet
- Colors close to one another should be similar.
- On jet, in some parts the color changes dramatically over a small range.
- Also colorblind people (about 8% of the population) can have difficulty with the red colors in jet.
- For more on this see this talk by the creators of viridis.
15
Jet Colormap

16
Viridis colormap

17
In ggplot2
Ordered factors now use viridis by default.
ggplot(diamonds,aes(y=price,x=carat,col=cut))+ geom_point(size=0.2)
18
Continous color
ggplot(data = mpg,mapping = aes(x=displ,y=cty, col=hwy))+geom_point()
19
Continous color
- To use viridis for a continous variable simply add
scale_color_viridis_c(). - Scale is another element of the grammar of graphics.
ggplot(data = mpg,mapping = aes(x=displ,y=cty, col=hwy))+ geom_point()+scale_color_viridis_c()20
Viridis

21
Variations on Viridis
ggplot(data = mpg,mapping = aes(x=displ,y=cty, col=hwy))+ geom_point()+scale_color_viridis_c(option = 'C')
22
Caution
- There are some situations where viridis may not be ideal.
- Nominal variables
- Divergent scales
- Divergent scales can be used when there is a natural middle point for the data (usually zero).
- For when plotting budget or trade balances using color, red can be used to show deficit and blue can be used to show surplus.
23
Divergent Scale
ggplot(data = mpg,mapping = aes(x=displ,y=cty, col=hwy))+ geom_point()+scale_color_distiller(type = 'div')
24
Facetting
25
Facetting
- Sometimes we cannot display everything on a single plot
- In this case facetting can be used to construct multiple plots
- For the next example we look at the
txhousingdataset
26
Code for facetting
ggplot(data = txhousing, mapping = aes(x=date, y=sales))+ geom_line()+ facet_wrap(~city)Note the tilde (~) in ~city
27
Texas Housing

28
Scales
- A problem here is that due to the scaling on the y axis, only the large cities display anything interesting.
- The option
scalesin thefacet_wrapfunction allows each plot to have its own scale. - Use this with caution!
29
Free scales
ggplot(data = txhousing, mapping = aes(x=date, y=sales))+ geom_line()+ facet_wrap(~city,scales = 'free_y')30
Texas Housing

31
Change number of rows
- The number of rows or columns can be changed with the
nroworncolarguments
ggplot(data = txhousing, mapping = aes(x=date, y=sales))+ geom_line()+ facet_wrap(~city,scales = 'free_y',nrow = 12)32
Changing number of rows

33
Facet grid
- We can also facet so that the rows correspond to one categorical variable and the columns to another.
- Lets try this with the diamonds dataset
ggplot(data = diamonds, mapping = aes(x=carat, y=price))+ geom_point()+ facet_grid(rows = vars(cut), cols = vars(color))34
Facet grid

35
Your Turn
- Plot a scatterplot with
- Sales on the x axis
- Median on the y axis
- Facet by year on the rows
- Facet by month in the columns
36
Solution
ggplot(data = txhousing, mapping = aes(x=sales, y=median))+ geom_point()+ facet_grid(rows = vars(year), cols = vars(month))37
Higher Dimensions
38
Pairs plot
- A pairs plot gives an array of plots
- On the diagonal there are kernel densities or barplots
- On the lower diagonal are scatterplots or facetted histograms
- On the upper diagonal are correlations or boxplots.
- This can be implemented using the ggpairs function in the GGally package.
39
Economics data
ggpairs(economics)
40
The Iris data
- The iris data is an old dataset on three species of flower with different measurements of the flower.
- The aim is to classify each flower into its species.
- However since it has a mix of metric and non-metric variables it is often used an an example for demonstration.
41
Iris data
ggpairs(iris)
42
Parallel Coordinates
- A parallel coordinates plots the variables of all values along the y axis.
- The variables themselves appear along the x axis.
- Values corresponding to the same observation are joined up by lines.
- They can often look messy but sometimes provide insight.
43
Parallel Coordinates
ggparcoord(iris)
44