Additional Issues
Data Visualisation and Analytics
Anastasios Panagiotelis and Lauren Kennedy
Lecture 7
1
Minor adjustments
2
Minor adjustments
- Sometimes we would like to add a title to a plot or change the labels.
- This is achieved by
labs
- This is achieved by
- Sometimes we may wish to change the general look
- This is achieved by the
themefunction and functions in theggthemespackage.
- This is achieved by the
3
Change labels
economics%>% ggplot(aes(x=psavert,y=uempmed))+ geom_point()
4
Change labels
economics%>% ggplot(aes(x=psavert,y=uempmed))+ geom_point()+labs(title = 'Savings v Duration')+ xlab('Savings Rate')+ ylab('Medium Duration of Unemployment')
5
Change theme
economics%>% ggplot(aes(x=psavert,y=uempmed))+ geom_point()+theme_classic()
6
Change theme
economics%>% ggplot(aes(x=psavert,y=uempmed))+ geom_point()+theme_bw()
7
One from ggthemes
economics%>% ggplot(aes(x=psavert,y=uempmed))+ geom_point()+theme_economist()
8
Another from ggthemes
economics%>% ggplot(aes(x=psavert,y=uempmed))+ geom_point()+theme_wsj()
9
Theme
- You can customise your own themes using the
themefunction. - There are many guides for using this
- One can be found here.
10
Annotation
- Remember that plots tell a story.
- Sometimes it helps to add text to a plot to help tell this story.
- This can be done with the
annotatefunction.
11
Annotate
economics%>% ggplot(aes(x=psavert,y=uempmed))+ geom_point()+ annotate('text', x=4,y=24,label='Bad Times!',size=5,col='red')
12
More on time series
13
Many time series on one plot
- It is common to see multiple time series on a single plot.
- This can be achieved using the
groupaesthetic. - We will do this with the
txhousingdata. - Suppose we are looking at
salesandlistingssince 2010 for Houston only.
14
Houston Data
txhousing%>% filter(city=='Houston',date>2010)%>% select(date,sales,listings)->houston_sales_listingshouston_sales_listings%>% pivot_longer(cols = -date, names_to = 'variable', values_to = 'value')%>% ggplot(aes(x=date,y=value,group=variable))+ geom_line()15
Houston Data

16
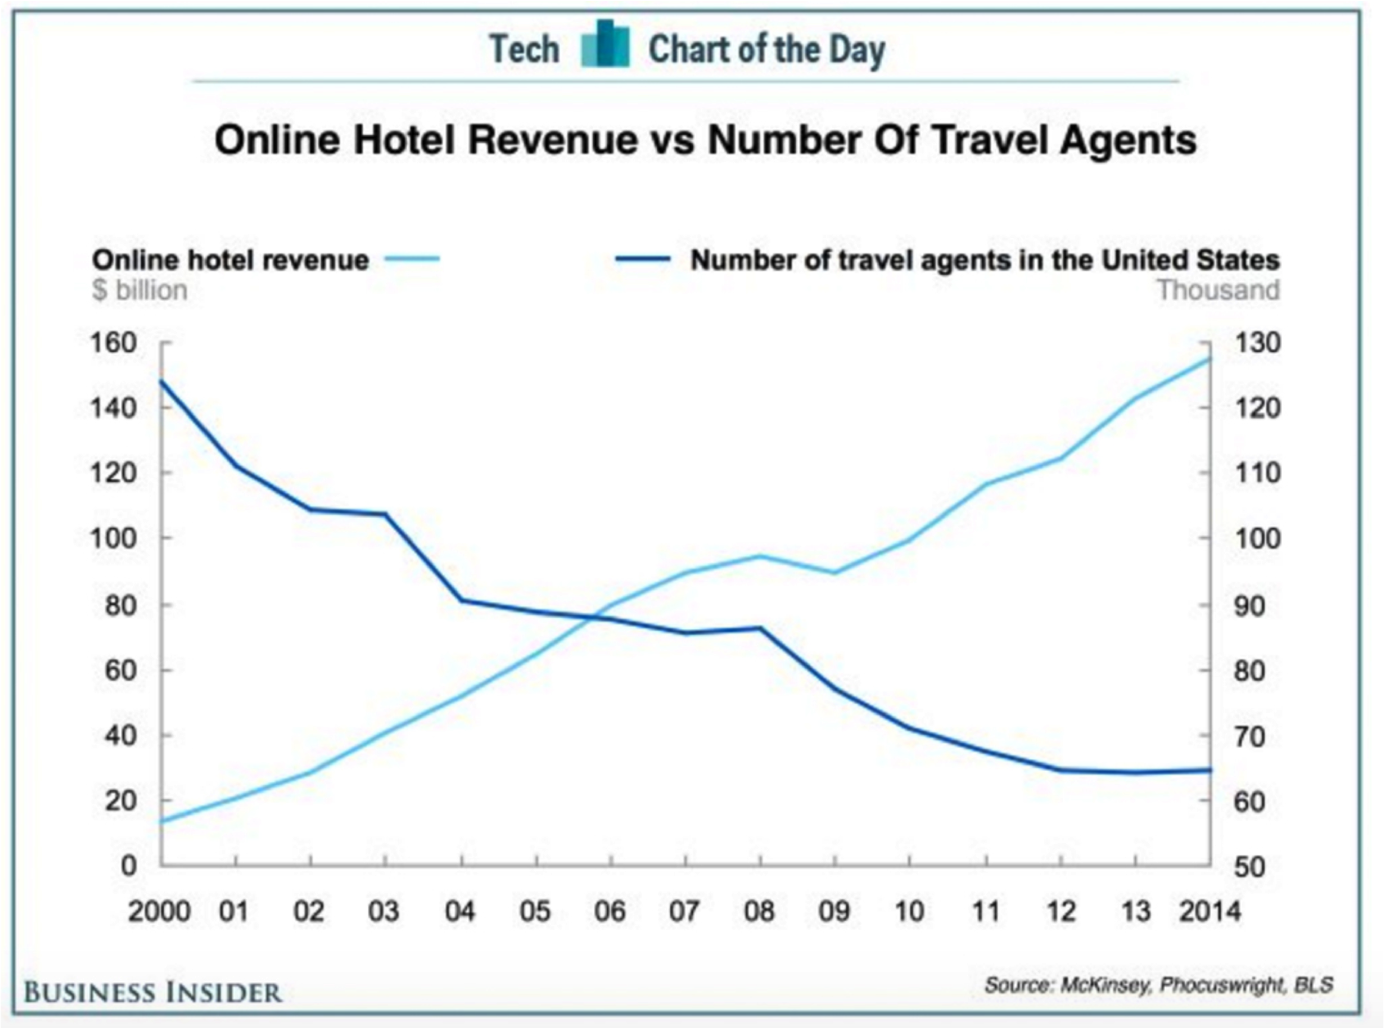
Beware
- Plotting time series measured in different units on the same plot is very very risky.
- Something commonly seen is a plot with two time series but with different y axes.
- For some debate on this issue see this discussion .
- Crossing points can be manipulated by arbitrarily changing the scale.
17
Crossing points

18
Aspect Ratio
- Another issue when looking at time series plots is the aspect ratio.
- The aspect ratio is the ratio of the width to the height of the plot.
- For time series plot larger aspect ratios can make trends look smaller.
- Aspect ratio can be controlled through the
coord_fixedfunction
19
Aspect Ratio
houston_sales_listings%>% ggplot(aes(x=date,y=sales))+ geom_line()+ coord_fixed(ratio=0.002)houston_sales_listings%>% ggplot(aes(x=date,y=sales))+ geom_line()+coord_fixed(0.0001)20
Aspect Ratio


21
Banking to 45
- An old rule of thumb suggested by Cleveland is banking to 45 degrees
- Find the slopes of every line joining a point at time t to the the point at time t+1.
- Set the aspect ratio so that the median of these is 45 degrees.
- It is only a rough guide and has recently been called into question.
22
Alternatives
- If we are looking for the relationship between two variables it is often better to look at a scatterplot.
- A problem with this is that the dimension of time is lost.
- Time can however be represented using color and the
geom_pathgeometry.
23
Scatter plot
houston_sales_listings%>% ggplot(aes(x=listings,y=sales))+ geom_point()
24
Path plot
houston_sales_listings%>% ggplot(aes(x=listings,y=sales, col=date))+ geom_path()+scale_color_viridis_c()
25
Modelling
26
Modelling
- Often visualisation is conducted with modelling in mind
- Scatterplots can be visualised with a model fit as well
- This is done using
geom_smooth - We can illustrate using the
mpgdata.
27
Scatterplot

28
With fitted curve
ggplot(mpg,aes(x=displ,y=cty))+ geom_point()+geom_smooth()
29
Smooth fit
- The fitted line by default comes from the LOcal Estimated Scatterplot Smoothing (LOESS) method.
- This technique combines the idea of nearest neighbours with regression.
- Nearest neighbours are found (along the x-axis)
- A constant, linear or quadratic regression is fit to the nearest neighbours.
30
Nearest Neighbours

31
Nearest Neighbours

32
Local fit

33
Nearest Neighbours

34
Details
- In the LOESS algorithm, the smoothing parameter α is defined as the proportion of observations used as nearest neigbours.
- If α=0.2 and n=20 then k=4 nearest neighbours are used.
- By default α=0.75 in R.
- It is common to use weighted regression whereby closer neighbours are given more influence.
- LOESS is not ideal for large datasets.
35
Linear fit
Linear regression can be used instead of LOESS
ggplot(mpg,aes(x=displ,y=cty))+ geom_point()+geom_smooth(method = 'lm')## `geom_smooth()` using formula 'y ~ x'
36
With Colour
ggplot(mpg,aes(x=displ,y=cty,col=drv))+ geom_point()+geom_smooth(method = 'lm')## `geom_smooth()` using formula 'y ~ x'
37
Confidence bands
- The grey ribbons give an indication of uncertainty around the estimated line.
- These relate to uncertainty around the estimate of the regression slope (or LOESS curve).
- Since regression includes a noise term, observations can easily lie outside the confidence ribbons.
38
Interactivity
39
Visualisation on the web
- Plots these days are often looked at on a website or at least on a computer.
- This is in contrast to the recent past when most plots were eventually printed onto paper.
- This allows the user to interact with plots.
- An example of this is the plotly software.
40
Plotly and ggplot
- There is an R package called
plotlywhich allows plotly to be easily used with ggplot. - Simply store the result of ggplot in a variable and then run the function
ggplotly
houston_sales_listings%>% ggplot(aes(x=listings,y=sales, col=date))+ geom_point()+scale_color_viridis_c()->gggplotly(g)41
Plotly
42
More plotly
43
Code
houston_sales_listings%>% mutate(Era=ifelse(date>2014, 'Post 2014', 'Pre 2014'))%>% ggplot(aes(x=listings,y=sales, col=Era))+ geom_point()->gggplotly(g)44
Summary
- Other interesting tools include the
gganimatepackage.- As the name suggests this allows for easy animation.
- Also the
shinypackage- This allows for the design of interactive web apps.
- You now have a strong base in R to teach yourself these how to use the tools.
45
Final Exercise
Create this plot

46
Solution
txhousing%>% filter(month==4,city%in%c('Houston','San Antonio', 'Dallas','Austin'))%>% ggplot(aes(x=sales,y=median,col=year,label=year))+ geom_path()+ geom_text(size=2,color='black')+ scale_color_viridis_c()+ labs(title = 'Median Price v Number of Sales in April for four Texan Cities')+ xlab('Sales (Number of Houses)')+ ylab('Median House Price ($US)')+ facet_wrap(~city,scales = 'free')47